Iowa Ag Ed Update

FFA Annual Report Summary
Home
Deadlines & Dates
State FFA Leadership Conference (SLC)
WLC Bus Trip Registration
Iowa FFA Officer Team
District Updates
Member Information
Iowa FFA Annual Report
FFA Members Only !
CDE Results
CDE Rules & Resources
Instructor Information
Program of Study
Team AgEd Members
Blogs (Ag Ed/FFA )
File Download
FFA Board Policies/Minutes
Site Index
Links/Contacts

Annual FFA Report FY09
The following links will allow you to more EASILY and more QUICKLY complete the FY09 Annual FFA Report.  You may update last year's Annual Report (Excel file), but I would prefer if you used these Quia survey files. 

The AgTED  is designed for Ag Ed students to enter their own information.  The "AgTED Student Sheet" is a simple way for you to help student's in securing the information they will need to complete the AgTED.  Instructors/Advisors will NEED to give students the School ID Number and the Individual ID Numbers they will need to complete the AgTED.  Students that you will NOT have in class later this year, may complete the AgTED now!

Instructors will also need to complete parts A & B, to enter "program" and "teacher contract" information.  It may sound complicated, but I believe you will find this approach to completing the Annual Report...much, much easier.  And less time consuming!

Student Portion:


Teacher Portions:

Horizontal Divider 1

Annual FFA Report FY08 (blank template)

Iowa FFA Quick Facts

The following summary is based on data collected on over 16,000 secondary agricultural education students. 

FY08 Data

2008.Southwest.District.FFA.Leadership.Conference/CareerPathwaysInterest_ALL.jpg
Do Agricultural Education, FFA, and SAE make a difference?
 
You decide...

FY06 Data Summary

2007 Annual Report Brochure

2006 Annual Report Brochure

Where do agricultural education students live?
Contrary to popular belief agricultural education programs draw their students equally from rural and town/city residences.
  • 51% live in rural residences
  • 49% live in town/city residences

Agricultural Education students are...

  • 66.6 % male
  • 33.4% female

Leadership Development?

  • 99.4 % of FFA members were classified as involved in their local chapter activities.
  • 60.4 % of FFA members attended an organized leadership development training or conference.
  • 21 % of FFA members served in leadership roles as chapter officers.

    Examples of Leadership Development Activities:

  • 2058 students participated in Freshmen Creed Speaking training and competition (local through National)
  • 1734 students participated in Parliamentary Procedure training and competition (local through National)
  • FFA members participated in an average of 2 CDEs per member

Personal Growth?

  • 19,084 = combined CDE participation by all FFA members  
  • From 2002 to 2006, the number of Agriscience Demonstrations or Experiments conducted by FFA members has increased by 13 %
  • 4618 students were entrepreneurs
    • 743 students owned and operated agribusinesses
    • 3875 students owned and operated agricultural production enterprises
  • 6425 students were involved in placement or internship experiences
  • $ 14,719,682.14 = dollars earned by agricultural education students through their Supervised Agricultural Experience programs
  • Agricultural education instructors are actively involved in a students experiential learning program.  Instructors conducted an average of 1.3 supervisory visits per student.

Career Success?

  • 86% of Agricultural Education program completers were FFA members, and FFA members were more likely to complete the educational program sequence than non-members.
  • 89.7 % of the students classified as occupationally proficient were FFA members.  FFA members were more likely to be classified as proficient than non-members.
  • FFA members were more likely to score proficient in science than non-members. (Based on the Iowa Test of Educational Development scores.)
  • FFA members were more likely to score proficient in Math  than non-members. (Based on the Iowa Test of Educational Development scores.)
  • FFA members were more likely to score proficient in reading than non-members. (Based on the Iowa Test of Educational Development scores.)
  • Juniors that completed 2.5 or more units had a higher average science % than students that completed less than 2.5 units.
  • Students with career experience programs (SAE) were almost twice as likely to score proficient in math than students without career experience programs.
  • FFA members completed more units of Agricultural Education instruction than non-members.
  • FFA members complete the sequential program at rates 50-60% higher than non-members. (Based on juniors and seniors.)
  • In all academic areas, students with career experience programs were more likely to score proficient than students without career experience programs.
  • FFA members are more likely to pursue postsecondary education than non-members.
  • Based on a cohort group comparision from 8th to 11th grade, students that were FFA members appeared to show more growth in science than ag ed students that were not FFA members. 

(Gruis, D. (2006) The FFA Difference: Annual FFA Report Summary FY06.)

Enter content here

Ag Ed Public Hearing ICN Powerpoints
(archived from March 2006)

Iowa Education and Ag Ed Data Powerpoint

Future Talk 2005 Presentation (This link will take you to ISU's website where you will find a link for the Powerpoint.)

Other Quick Facts:
 
Enrollment in high school Agricultural Education programs has increased by nearly 7000 students since 1990.
 
72% of the College of Agriculture students, at Iowa State University, were FFA members in high school.
 
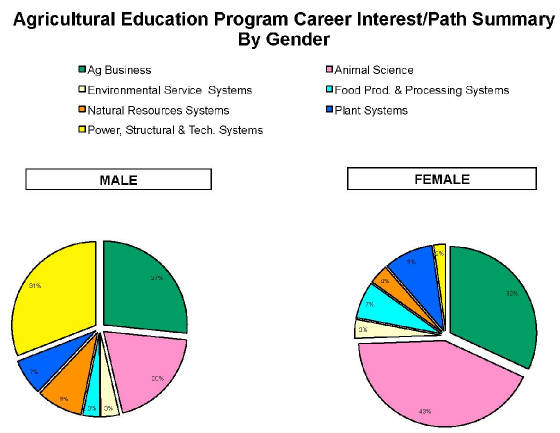
Much of the increase in enrollment can be attributed to increased participation by female students. (M. Retallick, 2002)
 
Return On Investment: In 2001, based on an hourly average, students earned over $18 million through their SAE programs.  During that same time period school districts claimed program expenses of $9.5 million. (Retallick, M. (2002) The Determinants of Supervised Agricultural Experience Program Participation Trends in Iowa, 1991-2001.)
 
Over a lifetime, the average high school graduate will earn $540,000 more than the average high school dropout. (Veale, J.R. (2002) The Cost of Dropping Out of School: Iowa 2001.)
 
Employment trends indicate that 80% of jobs will require some level of postsecondary education.
 
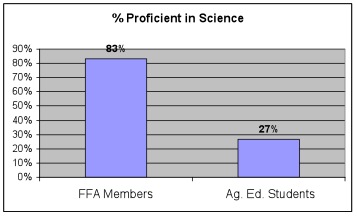
In FY02 through FY06, Agricultural Education students that had SAE programs and were FFA members outperformed non-members academically, and were more likely to pursue postsecondary education. (Gruis, D.(2002, 2003, 2004, 2005, 2006) The FFA Difference: Annual FFA Report Summary.)
 

Enter content here

Enter supporting content here